Software to create digital twins of low-voltage electricity grid
Siemens has launched software for low-voltage grids with digital twins.
LV Insights X software, part of the Siemens Xcelerator portfolio, enables distribution grid operators (DSO) to significantly increase grid capacity. These grids are already pushed to their limits by the fast increase of decentralized renewable energy infeed and additional consumers such as EV chargers or heat pumps. To avoid power grids from becoming the bottleneck of the energy transition, utilities urgently need to increase their grid capacity and actively manage the low-voltage grid.
- Siemens to build digital twin of Australia’s energy grid
- Siemens teams to build digital twins of electricity grids
- Nexans tool builds digital twin of the energy grid
LV Insights X provides visibility of low-voltage level of the grid, reduce outage times by up to 30 percent and increase grid capacity by identifying critical segments. The software lets operators create and manage complete low-voltage grid models automatically and with significantly reduced effort. Ultimately, they can create a digital twin of the distribution grid with already existing data. The new software paves the way for adaptable and scalable low-voltage grid management.
“Low-voltage grids can become a trailblazer on our path to net zero,” said Sabine Erlinghagen, CEO of Siemens Grid Software. “But only if we deploy software to increase the capacity of the existing grids quickly. That’s why we are extremely proud to launch LV Insights X. As an industry first, this software enables utilities to actively manage low-voltage grids to gain speed for transforming the overall energy system, make maximum use of the existing infrastructure, and ultimately shape the energy transition.”
The LV Insights X software combines data from across the operator systems, reducing data handling efforts by up to 80 percent and the time required for grid model maintenance by 50 percent.
A digital twin of a low-voltage grid can be created easily by integrating data from various sources such as geographical information systems (GIS), Meter Data Management (MDM) systems, and Advanced Distribution Management Systems (ADMS).
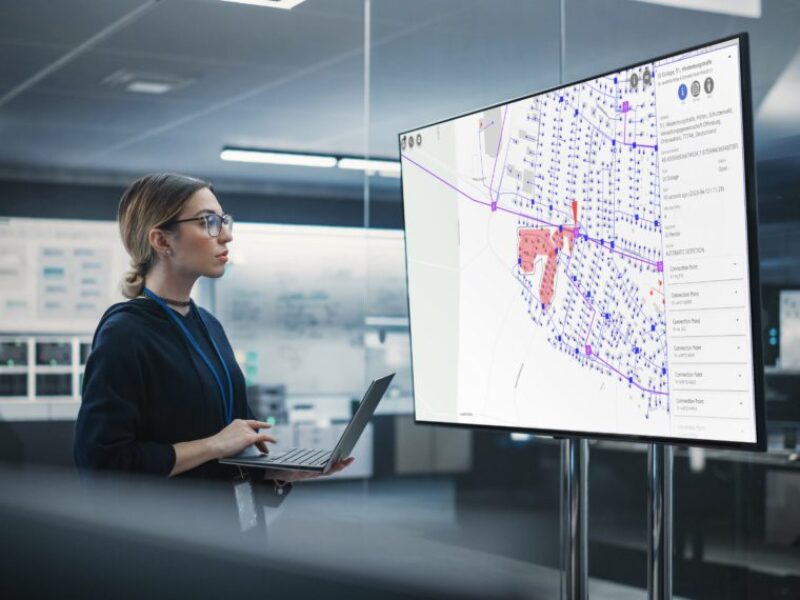
The complete grid topology and all information on the near-real-time grid status become visible and can be monitored at any time via a modern, browser-based user-centric graphical interface – even via mobile devices outside of the control room.
For example, with outage zones being visualized on a map, grid operations engineers can identify outages much faster, while an integrated ping function allows them to quickly check the impact of faults. In addition, utilities can significantly improve their planning accuracy, optimize their entire planning activities, and increase the effectiveness of their investments.
 If you enjoyed this article, you will like the following ones: don't miss them by subscribing to :